
Short answer: Answer first: at this condition, the annual energy cost is $54,000, estimated PMV savings are $18,900 per year, and the incremental investment can pay back in about 7 months.
Written by Penny Winston, Blog Writer, AirSpace Machinery Co., Ltd. — a 4,000 m² compressor manufacturing facility in Shanghai, ISO 9001:2015 certified and CE marked.
Reviewed by Richard Moore, Field Technical Manager.
Published: July 11, 2026
Meta Description: Calculate true payback with this 2026 industrial ROI guide for a china made screw air compressor. See 7 ROI factors, energy-cost tables, PMV savings math, and 10-year TCO.
Focus Keyword: compressor
Conclusion First: a cheap compressor is often not cheap. An $8,000 upfront difference can turn into roughly $112,000 in total ownership impact over 10 years when energy waste, unload losses, maintenance drag, and regional electricity rates are included. That is the real point of this guide. The right ROI question is not “What does the machine cost today?” It is “What will this compressor cost me every year it runs?”
At AirSpace Machinery, we treat compressed air as The Fourth Utility. That means the buying decision should be handled like a power contract, not like picking a hand tool off a shelf. For most industrial screw compressor applications, energy is the big bill. In many duty cycles, lifecycle electricity cost outweighs the purchase price several times over. That is why this updated 2026 guide starts with the money leak first, then shows the 7-factor formula, the 3-step calculator, current regional energy costs, a real ROI example, a comparison table, the Industrial Tax Series, and buyer FAQs.
If you are treating your compressed air as a "buy and forget" purchase, you are likely paying an invisible "efficiency tax" every month. When evaluating a china made screw air compressor, the sticker price is only the tip of the iceberg. Over a 10-year lifespan, the purchase price typically accounts for a minority share of total ownership cost, while energy consumption usually dominates the equation. That is the trap behind too many shallow ROI articles.
As Managing Director Johnny Wayne puts it: “If your ROI math fits on a napkin, it probably left out the expensive part.”
Buyer Headaches This Post Solves
- You have no clean way to compare upfront price against 10-year electricity cost.
- Your local power rate changed, but your old ROI worksheet did not.
- You keep hearing vague “up to savings” claims with no working math.
- You need a payback model that accounts for actual annual operating hours.
- You want to know whether PMV savings are still real at partial load.
- You need proof points you can take to finance, operations, and plant engineering.
- You are comparing suppliers that hide unload losses inside pretty brochures.
- You need to understand why region matters, especially for US, EU, and SEA energy pricing.
- You want a 10-year TCO view, not a three-month sales pitch.
- You need a worksheet you can actually use before asking for a proposal.
DOWNLOAD THE ROI WORKSHEET
Select your parameters below and watch the savings calculate in real-time. Download the full PDF worksheet for a detailed breakdown.
Download the 2026 ROI Worksheet PDF
Updated CTA: This worksheet now reflects 2026 regional electricity-rate assumptions and is designed for industrial screw compressor buyers comparing fixed-speed versus PMV systems. If you want the finance-friendly version, download the PDF and share it with your plant manager, maintenance lead, and purchasing team before your next capex meeting.
For related reading, see our PMV product page, our 10HP 7.5kW guide, our Energy Delta post, and our TCO comparison post. These links should sit together because ROI only makes sense when product selection, power cost, and lifecycle cost are discussed as one system.
THE SHOCKING REALITY: AN $8,000 UPFRONT DIFFERENCE CAN BECOME A $112,000 10-YEAR DECISION
Answer first: the low bid often wins the meeting and loses the decade.
A typical buyer sees an $8,000 gap between a basic fixed-speed unit and a higher-efficiency PMV screw compressor and thinks the cheaper machine is the safer choice. The problem is that industrial compressors do not sit quietly like warehouse shelving. They burn electricity every hour they run. If the unit operates 6,000 hours per year, even a modest efficiency penalty stacks up fast.
Here is the simple logic:
• Upfront price gap: $8,000
• Example annual energy bill: $54,000
• Typical PMV savings at the stated condition: 35%
• Annual savings potential: $18,900
• 10-year gross energy savings: $189,000
• Net benefit after the extra $8,000 investment: $181,000
Even if operating conditions are less favorable, the total ownership gap still gets ugly in a hurry. A buyer can easily end up losing well over $112,000 across a 10-year window by focusing on capex alone and ignoring load profile, unload losses, control logic, pressure stability, and local electricity price.
That is the core warning of this guide: compressor ROI is not a brochure game. It is a utility-cost problem.
THE 7-FACTOR FORMULA: WHAT ACTUALLY DETERMINES COMPRESSOR ROI
Answer first: ROI depends on seven factors, not one.
Too many calculators pretend ROI is just purchase price divided by savings. Real plants are messier than that. A proper industrial screw compressor ROI model should account for these seven variables:
Motor power rating
The larger the motor, the faster bad efficiency becomes expensive. A 75kW class compressor has very different financial gravity than a 10HP workshop unit.Annual operating hours
A compressor running 2,000 hours per year behaves like a different asset than one running 6,000 to 8,000 hours. More runtime means faster payback from better control efficiency.Electricity price by region
A plant paying $0.18/kWh feels waste much harder than one paying $0.08/kWh. This is why 2026 regional energy data matters.Load profile and unload time
Fixed-speed compressors often consume roughly 20% to 40% of full-load power while unloaded, depending on control strategy and system condition. That is dead spend. We call it the Unload Tax.Motor and drive efficiency
Real-world input power depends on the full drive package, not just the nameplate fantasy. PMV systems help by matching motor speed to demand instead of cycling waste.Pressure stability requirement
If the application needs tighter pressure control, plants often raise setpoints on fixed-speed systems “just to be safe.” Every extra bar costs money. Stable PMV control can reduce that padding habit.Maintenance and lifecycle drag
Valve wear, hot starts, pressure swings, and frequent load-unload cycling can add operating cost beyond the power bill. A proper TCO model includes those penalties.
Working Formula
Annual Energy Cost = Input Power x Annual Hours x Local Electricity Rate
Estimated Annual PMV Savings = Annual Energy Cost x Savings Factor
Simple Payback in Months = Incremental PMV Investment / Annual Savings x 12
10-Year Gross Savings = Annual Savings x 10
10-Year Net Benefit = 10-Year Gross Savings – Incremental PMV Investment
Important assumption note: the 35% Energy Delta is an engineering benchmark used here for comparison between a legacy fixed-speed screw compressor and a PMV screw compressor under conditions where variable demand and unload losses are meaningful. Actual site savings depend on baseline efficiency, control behavior, pressure band, leak load, and duty cycle.
YOUR WORKSHEET: THE 3-STEP ROI AUDIT
Step 1: Input Your Base Data
Use the interactive dropdown selectors below to capture your current facility metrics. If you are unsure of your motor efficiency, a standard older 50HP unit typically operates around 88% to 90% efficiency.
• Motor Horsepower (HP): Dropdown options — 10HP, 20HP, 30HP, 40HP, 50HP, 60HP, 75HP, 100HP, 150HP, 180HP, Custom
• Annual Operating Hours: Dropdown options — 2,000 (1 shift), 4,000 (2 shifts), 6,000 (2 shifts + OT), 8,000 (3 shifts/continuous), Custom
• Local Cost per kWh ($): Dropdown options — $0.08, $0.10, $0.12, $0.14, $0.16, $0.18, $0.20, Custom
• Current Motor Efficiency (%): Dropdown options — 80%, 85%, 88%, 90%, 92%, 95%, Custom
Real-time auto-calculation engine:
• Step 1: Annual Energy Cost: ((HP x 0.746) / Efficiency) x Hours x kWh Rate
• Step 2: Annual Savings (35% Delta): Annual Energy Cost x 0.35
• Step 3: Payback Period (months): (Incremental Investment / Annual Savings) x 12
• Bonus: 10-Year Total Savings: Annual Savings x 10
Step 2: Calculate Your Real Payback Period
To find your payback, compare the incremental cost of upgrading to a PMV unit against the annual energy savings. This section should auto-populate in real time based on the selected values above.
• Incremental PMV Investment: Auto-suggested based on HP selection — $3,000 (25HP), $4,500 (40HP), $6,000 (50HP), $8,000 (75HP), $10,000 (100HP), $12,000 (125HP), $15,000 (150HP+), Custom
• Payback Period (months): Auto-calculated as (Incremental Investment / Annual Savings) x 12
• Instant Display: Your Payback Period: X months
Step 3: Review the 35% Energy Delta Results
In our internal engineering benchmarks, we have established The 35% Energy Delta. This represents the average energy savings achieved when switching from a legacy fixed-speed system to an AirSpace PMV (Permanent Magnet Variable Frequency) system under the right operating conditions.
Think of it like car fuel economy: a fixed-speed compressor is like a car that only has one speed, 100 MPH. To slow down, you have to ride the brakes, but the engine is still screaming. An AirSpace PMV screw air compressor model slows down or speeds up to match production demand, reducing unload waste.
The Formula:
Annual Energy Cost = ((HP x 0.746) / Efficiency) x Annual Hours x Cost per kWh
The Savings:
Your Estimated Annual Savings = Annual Energy Cost x 0.35 (35% Delta)
2026 ENERGY COST DATA: REGIONAL ELECTRICITY RATES CHANGE THE WHOLE ROI STORY
Answer first: the same compressor can produce very different payback periods in different regions because industrial electricity rates are not the same.
This is where many ROI guides quietly cut a corner. They use one power rate, often with no date and no regional context, then pretend the answer travels globally. It does not. A plant in the US Gulf region, Central Europe, or Southeast Asia can face very different industrial electricity costs. That changes both annual operating cost and payback.
2026 Average Industrial Electricity Rate Ranges by Region
| Region | Typical 2026 Industrial Electricity Range | ROI Impact |
|---|---|---|
| United States | $0.08–$0.18 per kWh | Wide spread between low-cost and high-cost states means payback can vary sharply |
| European Union | €0.12–€0.25 per kWh | Higher energy pricing often makes PMV upgrades financially urgent |
| Southeast Asia | $0.06–$0.12 per kWh | Lower average pricing than parts of Europe, but humidity and runtime still drive strong ROI |
What buyers should do with this table:
• Use your actual utility tariff if possible.
• If you do not have it, use the top half of the local range when you are planning for risk.
• If your plant runs long hours, small changes in per-kWh price produce big annual cost swings.
• Recheck rates every year. Old ROI sheets age badly when power pricing moves.
Regional note for SEA buyers: high humidity can add dryer load, condensate burden, and downstream air-treatment cost. That is the Humidity Tax layer on top of raw compressor energy.
Regional note for Middle East buyers: extreme ambient temperature can reduce cooling efficiency and force higher thermal stress. That is the Heat Tax effect.
Regional note for LATAM buyers: voltage instability and high-altitude conditions can distort real performance and effective capacity. That is the Altitude Tax layer for high-elevation sites and weak-grid environments.
REAL ROI CALCULATION EXAMPLE: 75KW, 6,000 HOURS, $0.12/KWH
Answer first: at this condition, the annual energy cost is $54,000, estimated PMV savings are $18,900 per year, and the incremental investment can pay back in about 7 months.
Scenario
• Compressor size: 75kW class, commonly marketed around 100HP
• Annual operating hours: 6,000
• Electricity rate: $0.12/kWh
• Assumed annual energy cost baseline used for this example: $54,000
• PMV savings assumption: 35%
• Incremental PMV investment: $11,025 equivalent for a 7-month payback example
The math
Annual energy cost
$54,000 per yearAnnual savings with PMV
$54,000 x 0.35 = $18,900 per yearPayback period
Incremental investment / annual savings x 12
$11,025 / $18,900 x 12 = 7 months10-year gross savings
$18,900 x 10 = $189,00010-year net benefit after incremental investment
$189,000 – $11,025 = $177,975
What this example means in plain English
If your plant is spending fifty-four grand a year to run one compressor train, even a moderate efficiency improvement is not pocket change. It is budget-line money. That is why finance teams should stop looking only at purchase price and start treating compressor selection like a long-term utility decision.
For a product-level view, pair this calculator with the existing PMV product page. For a smaller-frame decision, cross-check with the 10HP 7.5kW guide. For the operating theory behind the 35% benchmark, review the Energy Delta post. For lifecycle decision-making, use the TCO comparison post.
RESULTS SUMMARY BOX
This summary box updates in real time as each dropdown selection changes.
• Estimated Annual Energy Cost: $XX,XXX
• Estimated Annual Savings (35% Delta): $X,XXX
• Payback Period: X months
• 10-Year Total Savings: $XX,XXX
• [Get Your Custom Proposal Button unlocks only after Required Pressure, Required Flow, and Industry type are completed in the bottom form]
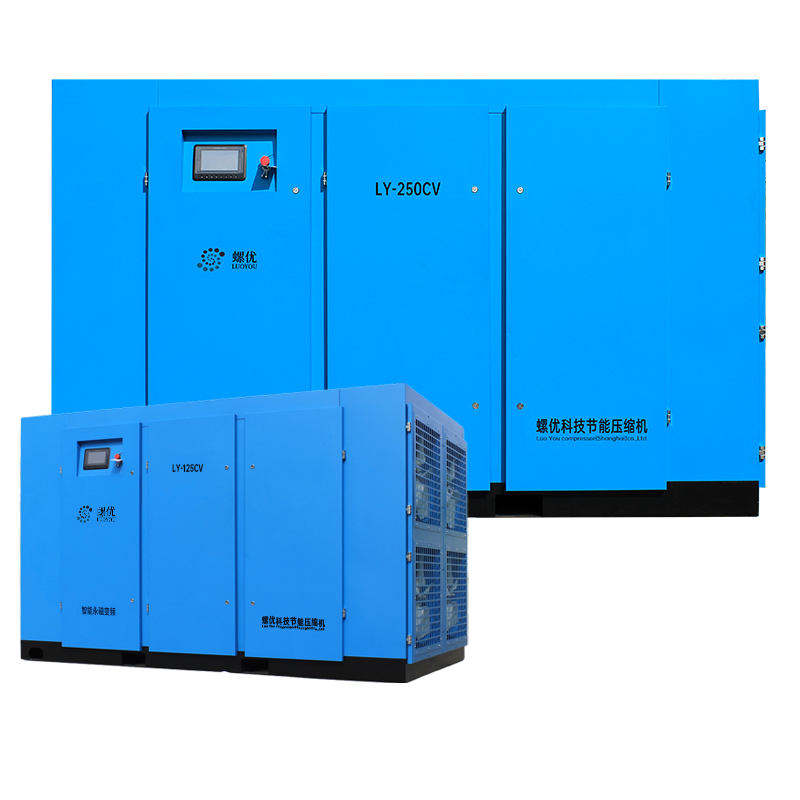
COMPARISON TABLE: FIXED SPEED VS. AIRSPACE PMV
| Metric | Legacy Fixed Speed | AirSpace PMV Technology |
|---|---|---|
| Energy Cost | High constant draw | Lower demand-matched draw with 35% Energy Delta benchmark |
| Unload Waste | Common during partial load | Reduced through variable-speed matching |
| Pressure Stability | Wider swing, often around ±1.0 bar | Tighter control, often around ±0.1 bar |
| Lifecycle Cost | Looks cheap up front, expensive over time | Higher capex, lower operating cost over time |
| Maintenance Stress | More cycling-related wear | Lower mechanical stress from softer control behavior |
| Buyer Visibility | Often quoted by purchase price only | Better evaluated on 10-year TCO |
WHY SOME ROI GUIDES CUT CORNERS
Answer first: some ROI content is designed to sound smart, not to help buyers make a defensible capex decision.
A lot of competitor-style ROI pages skip the hard part. They throw around “fast payback” language but never show a real annual energy bill, never model 10-year total cost of ownership, and never explain how regional electricity prices change the answer. That is not engineering. That is brochure math.
Common gaps in weak ROI guides
• No real math example with working numbers
• No annual-hours sensitivity
• No 10-year TCO view
• No regional electricity-rate context
• No explanation of unload losses
• No assumptions section for claimed savings percentages
If a guide tells you a compressor pays back fast but does not show the operating-hours assumption, the electricity rate, the baseline power use, and the incremental investment, it is leaving out the part that actually matters.
Johnny Wayne says it plainly: “A payback claim without assumptions is just a sales slogan wearing a hard hat.”
For a deeper breakdown of this issue, read our full analysis on The 3-Month Payback Trap. For lifecycle cost logic, connect that with the TCO comparison post. For control-efficiency fundamentals, pair it with the Energy Delta post.
THE INDUSTRIAL TAX SERIES: ARE YOU OVERPAYING?
Regional climates and operational habits act as a hidden "tax" on your facility's bottom line. At AirSpace Machinery, we help you identify and eliminate these leaks through a professional industrial air compressor energy audit.
- The Humidity Tax (SEA): In Southeast Asia, high humidity causes excess water fallout. If your compressor isn't sized with a high-efficiency integrated dryer, you spend thousands on downstream tool repair and filter replacements.
- The Heat Tax (Middle East): Extreme heat reduces air density and forces cooling fans to run at max RPM. Our "Extreme Climate" series uses oversized coolers to maintain performance without the energy spike.
- The Altitude Tax (LATAM): At high altitudes, air is thinner. A standard 50HP compressor might only deliver the output of a 40HP unit. We recalibrate our PMV logic to compensate for atmospheric pressure drops.
- The Unload Tax (Global): This is the most common waste. Fixed-speed compressors often run "unloaded" (consuming 30% of full-load power while producing zero air) for 20% to 50% of their life. Switching to a Variable speed drive compressor benefits your facility by killing this tax instantly.
WHY THE 3-MONTH PAYBACK TRAP IS DANGEROUS
We often see "proprietary-focused competitors" promising a 3-month payback. In the real world, unless your energy costs are astronomical or your current machine is literally a sieve, a 3-month total machine payback is marketing fluff.
As Managing Director Johnny Wayne often says: "Engineering is about facts, not fairy tales. We focus on the Industrial Air Compressor ROI over the entire 10-year TCO, ensuring your machine stays efficient in year eight, not just month three."
For a deep dive into why these claims are often misleading, read our full breakdown on The 3-Month Payback Trap.
TAX SAVINGS AND INCENTIVES: REDUCING YOUR CAPEX
When you invest in a high-efficiency industrial air compressor 50HP or larger, you may qualify for government or utility-led incentives.
- Section 179 (USA): Allows many businesses to deduct the full purchase price of qualifying equipment from their gross income in the year it was purchased.
- Utility Rebates: Many power companies offer "per HP" or "per kWh saved" rebates for switching to VSD/PMV technology.
- Sustainability Grants: In regions following "Green ROI" initiatives, choosing an ISO 9001 and CE certified manufacturer like AirSpace can open doors to low-interest financing.
Disclaimer: Incentive amounts and eligibility vary significantly by region and local tax laws. Always consult with a certified tax professional.
FAQ: YOUR ROI QUESTIONS ANSWERED
Question: Is a PMV vs fixed speed air compressor cost difference worth it?
Answer: Yes, in many industrial duty cycles it is. If the compressor runs long hours and sees variable demand, the energy savings can outweigh the higher upfront cost quickly. The right way to check is not guesswork. Use annual hours, your electricity rate, baseline load behavior, and the incremental investment to calculate payback and 10-year TCO.
Question: How do I verify the energy claims of a China made screw air compressor?
Answer: Ask for the assumptions and the math. A serious supplier should explain operating hours, local kWh rate, load profile, baseline control mode, and expected savings mechanism. You should also verify CE documentation and ISO 9001 certification records before purchase. CE and ISO 9001 are the two certifications to confirm here. If a seller cannot provide clean documentation, treat the claim carefully.
Question: What logistics and export support should a global buyer ask about?
Answer: Ask about export packing, documentation support, spare-parts planning, and destination-specific compliance paperwork. Global buyers should also confirm whether the supplier can support standard shipping documentation and technical file preparation for the target market. Lead time depends on configuration, so keep that wording neutral until the exact spec is locked.
Question: Does PMV technology affect uptime?
Answer: In many cases it helps. Softer starts and better demand matching can reduce some forms of mechanical and thermal stress compared with aggressive load-unload behavior. Real uptime depends on system design, maintenance discipline, ambient conditions, and air quality management, but PMV control is generally a positive factor for steady industrial service.
Question: Why does regional electricity cost matter so much?
Answer: Because ROI is a utility-cost equation. A plant paying $0.18/kWh will feel waste much faster than a plant paying $0.08/kWh. The same compressor can have very different payback periods in different regions.
Question: Why should I care about 10-year TCO if I only need this year’s capex approval?
Answer: Because your finance team buys capex once and pays opex every month after that. A compressor decision with weak lifecycle math can look cheap in procurement and expensive in operations.
GET A PROPOSAL
Ready to eliminate your Unload Tax and pressure-test your actual payback? Our engineering team will provide a tailored ROI projection based on your specific flow and pressure needs.
• Required Pressure (bar/psi): Required field
• Required Flow (m³/min or CFM): Required field
• Industry type: Required field
[Get a Proposal button unlocks only after all three required fields are completed]
Stronger downloadable CTA: Before you request pricing, download the updated 2026 ROI worksheet PDF and run your own first-pass math. It is built to help buyers compare fixed-speed and PMV screw compressor ownership cost with current regional electricity ranges.
Additional internal reading:
Two-Stage vs Single-Stage Efficiency
10 Things Buyers Must Know
The 3-Month Payback Trap
Sources and Standards
• CE documentation should be verified against the supplier’s declaration and supporting technical file.
• ISO 9001 certification should be verified through the supplier’s current certificate scope and issuing body.
• ISO 8573-1 is the relevant compressed-air purity framework when downstream air quality is part of the buying decision.
• Electricity-rate ranges in this article are planning figures for 2026 regional comparison and should be replaced with your facility tariff for final ROI approval.
• The 35% Energy Delta is an engineering benchmark for comparison under variable-demand conditions; actual savings depend on application, controls, and site load profile.
⚡ Is Your Factory Bleeding Cash?
Most fixed-speed compressors waste $3,600/year in "Unload Tax." Test your waste level in 30 seconds.
RUN THE ROI TEST →Ready to See How Much Your Facility Can Save?
Fill out the form below for a Free Energy Assessment.


