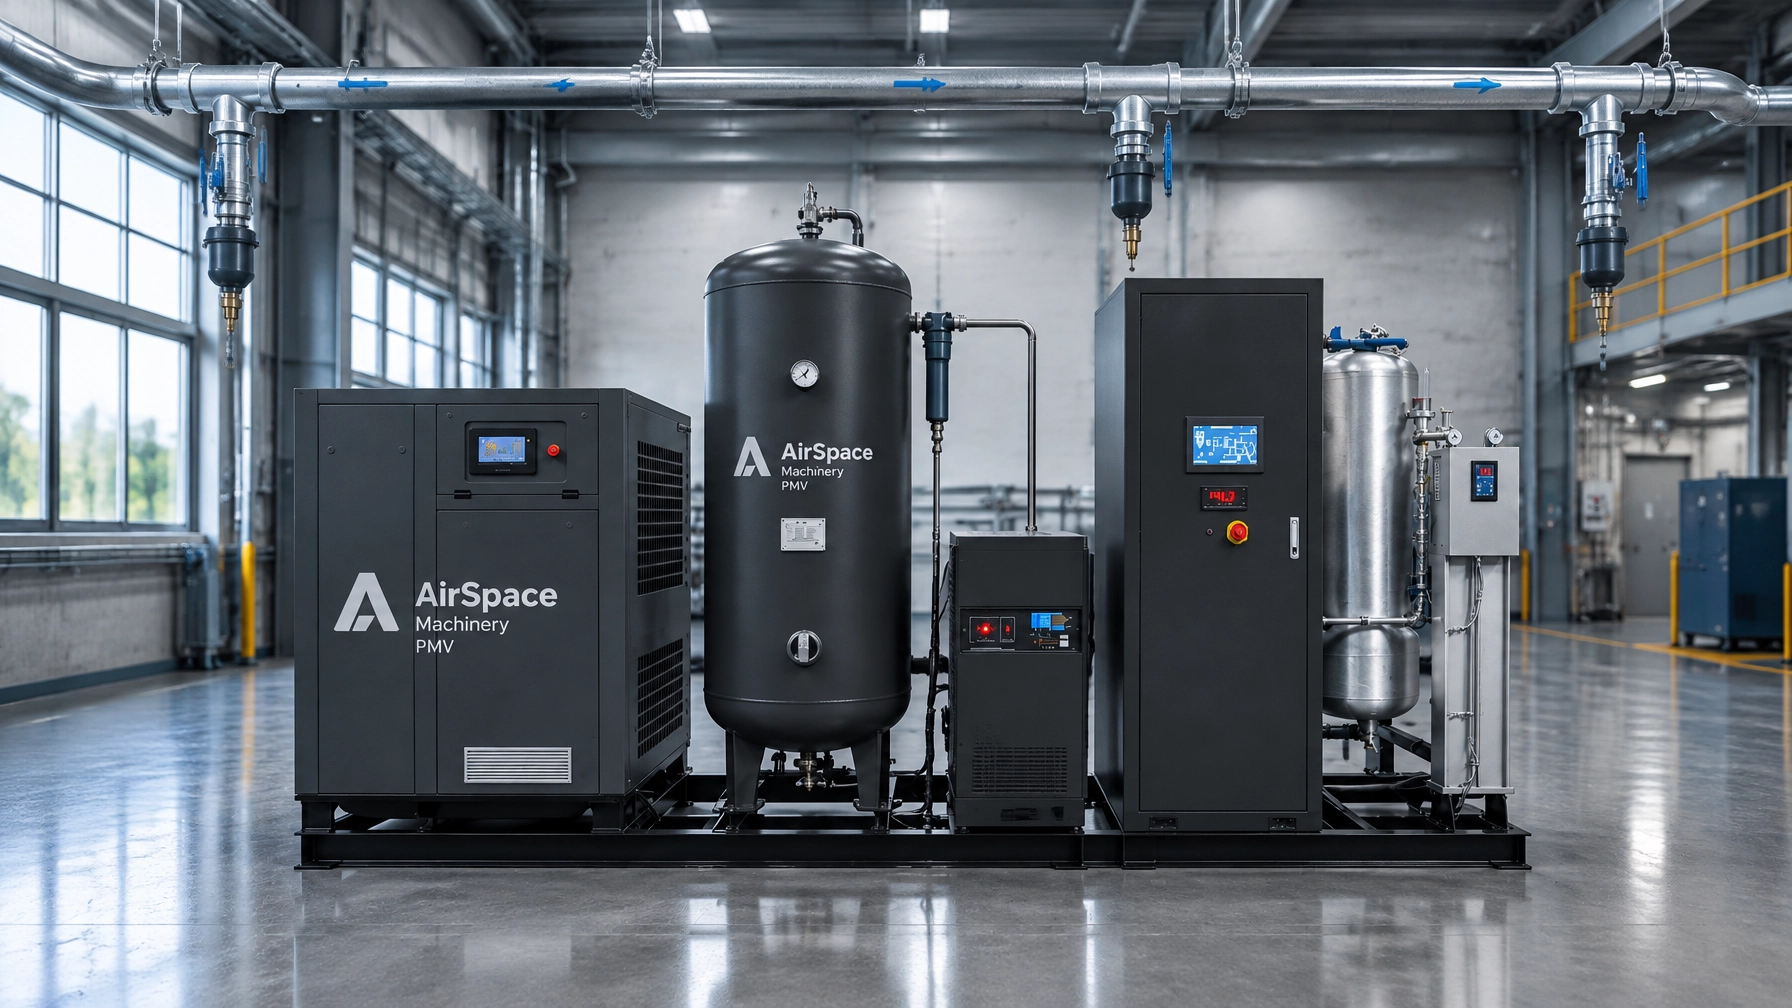
A bigger compressor is not the first answer to low pressure at a production line. First check for leaks, undersized piping, pressure loss, wet lines and demand peaks. A sound compressed air system design starts with measured flow and pressure at the point of use, then sizes the compressor, treatment, storage and distribution as one system.
This blueprint uses a closed-loop ring main, a main-line air-velocity target of 6–7 m/s with an upper design limit of 9 m/s, and a distribution pressure-drop goal of 0.1 bar where practicable. Keep total compressor-to-point-of-use pressure loss below 10% of operating pressure. These are project design targets, not universal code limits; confirm them against actual FAD, pressure, pipe dimensions, fittings and demand.
Answer first: before approving a larger compressor, design and verify the whole air system — demand, distribution, leaks, pressure loss and controls. Most “undersized compressor” complaints are actually upstream losses.
Key Takeaways
- Size the compressor, treatment, storage and distribution as one system, based on measured flow and pressure at the point of use.
- Target a ring-main air velocity of 6–7 m/s (max 9 m/s) and a distribution pressure drop near 0.1 bar where practicable; keep total loss below 10% of operating pressure.
- Repair and quantify leaks before adding capacity — the $18,150 figure is a planning benchmark, not a guaranteed saving.
- Consider PMV where demand varies; the 35% Energy Delta is a planning benchmark, not a guarantee.
- Request the gated PDF sizing worksheet and a free kWh forecast before specifying new equipment.
From the field: in plants we review, the costliest “compressor problem” is usually a leak, pressure or sequencing issue upstream of the machine — not the machine itself. One 110 kW plant we reviewed deferred a compressor upgrade after a leak-and-sequencing fix recovered enough capacity for current production, using the checks above rather than a nameplate guess.
THE $18,150 LEAK TAX: A PLANNING BENCHMARK, NOT A GUARANTEE
For a worked example, a 110 kW system running 5,500 hours a year at $0.12/kWh uses approximately $72,600 of electricity annually:
110 kW × 5,500 h/year × $0.12/kWh = $72,600/year
If leakage is assumed to represent 25% of system output, the proportional cost estimate is $18,150/year. DOE guidance reports that poorly maintained systems may lose 20–30% of compressor output through leaks. Applying that fraction directly to electricity cost is an estimate, not a measured site result.
Planning Benchmark, Not Guaranteed. The calculation assumes energy use tracks the leakage fraction proportionally. Actual savings depend on how the system is controlled, the leak profile, operating hours, production schedule, pressure and electricity tariff. Find and quantify leaks before using this number to justify a purchase. DOE’s compressed-air leak tip sheet describes leak reduction as an ongoing program of identification, repair and verification.
TEN PLANT HEADACHES THIS BLUEPRINT IS BUILT TO PREVENT
- Low pressure at a distant machine, despite high compressor discharge pressure.
- A proposal based on compressor nameplate capacity rather than measured demand.
- Leaks that quietly add run time and energy cost.
- Branch lines connected where condensate can enter them.
- Long, dead-end pipe runs that make pressure less stable.
- A dryer or filter that adds avoidable pressure loss.
- A short, high-volume demand spike that triggers a bigger compressor purchase.
- Wet air and corrosion in lines exposed to cooling or changing temperatures.
- An oversized compressor that runs inefficiently at part load.
- No defensible baseline for comparing energy use before and after changes.
Frequently Asked Questions
Q: WHY DESIGN THE WHOLE SYSTEM BEFORE SELECTING A COMPRESSOR?
Because compressor capacity alone does not determine whether air reaches a machine at the required pressure, flow and quality. The U.S. Department of Energy’s Improving Compressed Air System Performance: A Sourcebook for Industry, Third Edition, recommends taking a systems approach that considers supply, treatment, storage, distribution and end use together. Its distribution guidance supports loop layouts, sloped headers, accessible drop legs and branches taken from the top or side of a header.
Map demand first. Record the equipment’s required pressure and flow, when it operates, and whether several high-demand tools run together. Use measured flow where available; otherwise calculate simultaneous demand using realistic duty factors. Add a documented allowance for planned expansion rather than an arbitrary oversized safety factor.
For compressor selection, compare delivered FAD at the required operating pressure. Request performance data based on the same conditions and a recognized test method such as ISO 1217. A nominal power rating is not a substitute for flow and package input-power data.
Q: HOW SHOULD THE RING MAIN AND BRANCHES BE LAID OUT?
A ring main lets air reach a demand point from more than one direction, reducing dependence on a single long route. Keep the loop as direct as the building allows, and plan isolation valves so sections can be serviced without shutting down the whole plant.
| Design check | Practical target for this blueprint | What to verify |
|---|---|---|
| Ring-main air velocity | Aim for 6–7 m/s | Use actual FAD, pressure and internal pipe diameter |
| Maximum main-line velocity | Do not exceed 9 m/s | Check peak simultaneous flow, not average flow alone |
| Distribution pressure drop | Aim for 0.1 bar where practicable | Include fittings, valves and the farthest point of use |
| Total system pressure loss | Keep below 10% of operating pressure | Include treatment equipment and point-of-use components |
| Condensate management | Slope the header; install accessible drop legs | Confirm low points, dead ends and drain access |
The DOE Sourcebook recommends sloping distribution piping to accessible drop legs and drain points, with the slope directed away from the compressor. Take branches from the top or side of the header, not the bottom, to reduce the chance that collected condensate enters a production line. Provide drainage at low points and dead ends. Select drains that remove condensate without allowing a continuous loss of compressed air.

Q: WHAT SHOULD BE INCLUDED IN THE PRESSURE-DROP CHECK?
Measure the pressure from compressor discharge through treatment and distribution to the most demanding point of use. The pipe network target is 0.1 bar where practicable; the broader system criterion is less than 10% of operating pressure. Treat 0.1 bar as a design goal, not a guaranteed result or a universal standard.
Include the pressure drop across dryers, filters, valves, connectors, regulators and hoses. A restriction close to a machine can be mistaken for an undersized main. Compare pressure readings at more than one point under high demand before raising compressor pressure. Higher pressure can increase energy use and unregulated demand; it may mask the restriction rather than fix it.
A useful reference is the DOE Sourcebook, Fact Sheet 4: Pressure Drop and Controlling System Pressure. It recommends properly sizing distribution mains for maximum flow and allowing for system growth.
Q: WHEN DOES A LEAK CHECK BEAT BUYING A BIGGER COMPRESSOR?
When leaks are consuming capacity that production needs. Survey couplings, hoses, fittings, quick connections, valves, drains and idle equipment. Tag each leak, repair it, then recheck the system and adjust compressor controls to the reduced demand. DOE recommends an ongoing leak prevention program and identifies 5–10% of total flow as a typical target for cost-effective leak reduction.
The practical order is simple: establish the baseline, repair leaks, verify pressure and flow, then recalculate required capacity. If demand still exceeds supply, check the load profile, short-duration peaks, storage and compressor controls before adding capacity.
Q: WHEN IS PMV A BETTER FIT THAN FIXED-SPEED?
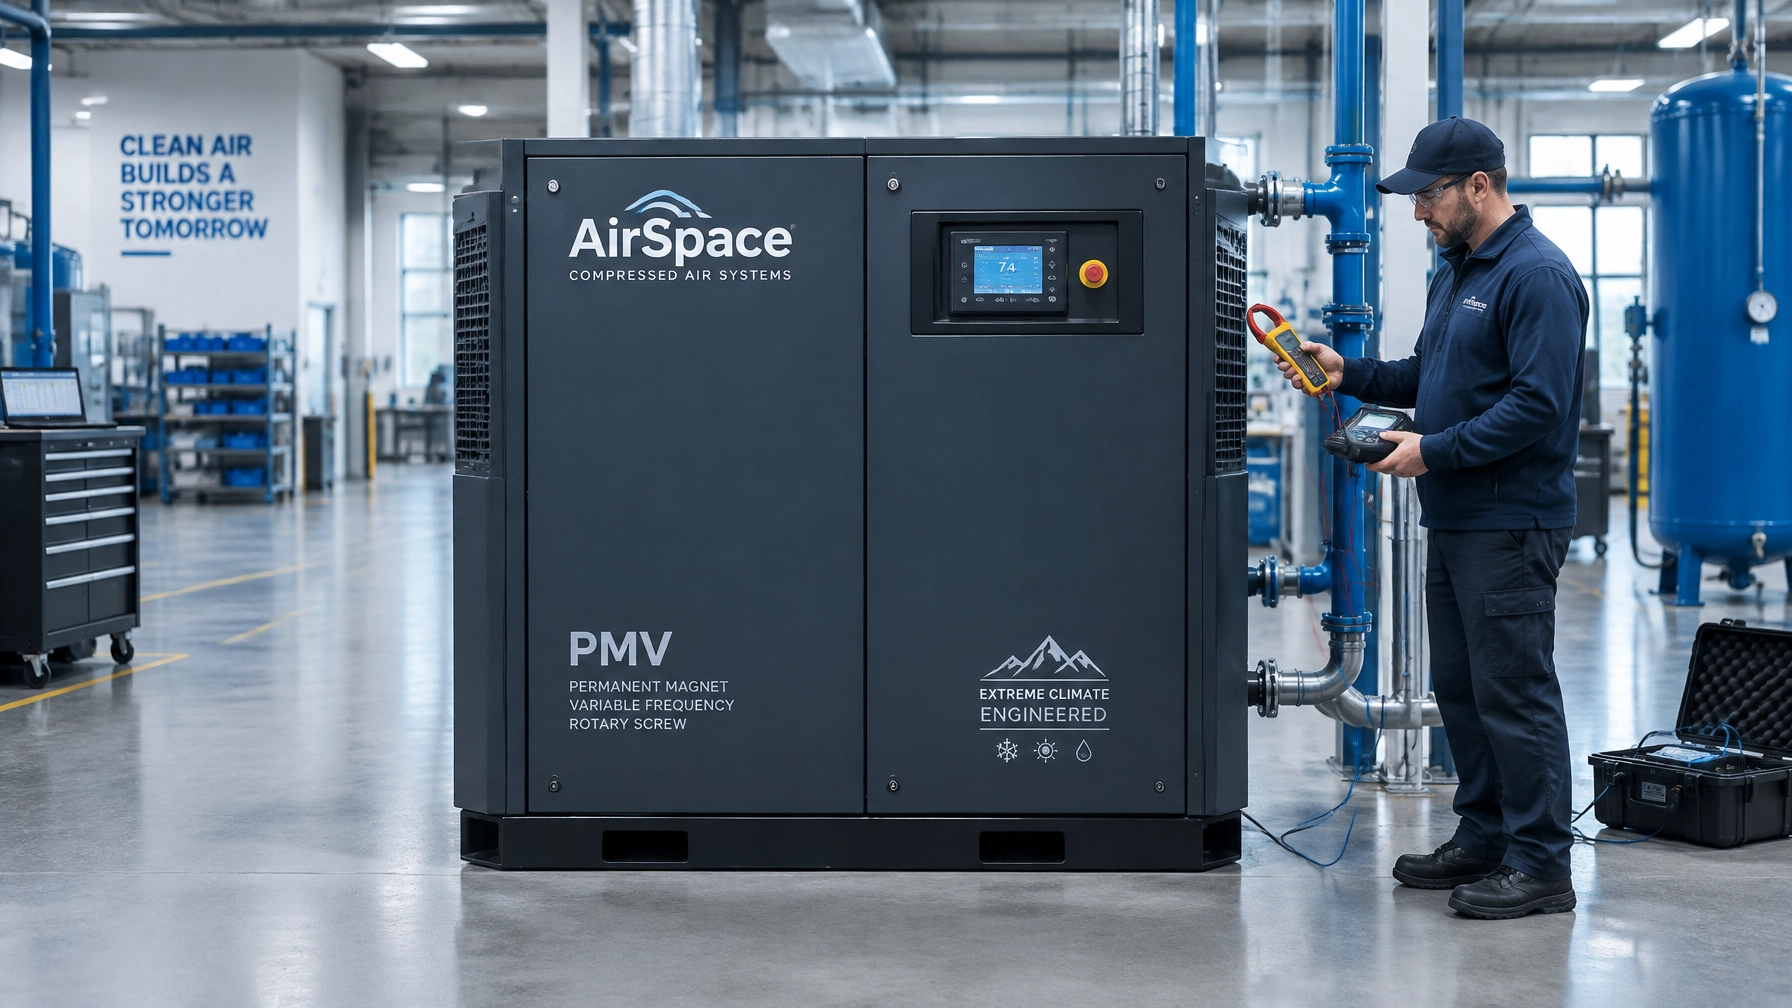
PMV variable-speed control can suit plants with fluctuating demand because compressor output can track changing air consumption. AirSpace Machinery uses the 35% Energy Delta as a planning benchmark for comparing PMV with standard fixed-speed systems under suitable variable-demand conditions. It is not a guaranteed saving; actual performance depends on measured load profile, pressure, operating hours, installation and model data.
Think of it like choosing a vehicle for a delivery route: the best answer depends on how it is used, not just the engine rating. Compare system input power and delivered FAD across the operating range, and use like-for-like conditions. The PMV compressor series and PMV sizing guide provide starting points for a configuration review.

Q: WHICH AIRSPACE CONFIGURATION SHOULD I REVIEW?
Match the equipment to actual pressure, flow and air-quality requirements, not a broad label like “factory air.”
- For 2.2–5.0 bar applications, review the AirStream low-pressure compressor series.
- For contamination-sensitive applications, review the AquaPure dry-type oil-free screw compressor. Confirm any ISO 8573-1 Class 0 claim against the test report for the specific model.
- For a coordinated compressor, receiver, dryer and filtration package, review all-in-one skid units.
- For general plant air, compare PMV options and ensure FAD is stated at the required pressure.

AirSpace Machinery has 20 years of engineering experience and annual sales of 100 million yuan. The design principle remains straightforward: specify high-tier, universal components and verify the delivered performance, screw air end, permanent magnet motor, variable-speed drive, controls, air treatment and drainage, against the application. Check CE documentation and the manufacturer’s ISO 9001 certificate scope and validity during procurement. Export packing and shipping arrangements should be confirmed with the quotation; lead time depends on configuration.
THE GATED PDF SIZING WORKSHEET
Request a technical quotation with a gated PDF sizing worksheet covering process demand, simultaneous use, required pressure, FAD, pipe routes, velocity, pressure loss, condensate points, air treatment and planned expansion. Include current compressor power, annual operating hours and electricity tariff so the energy baseline is transparent.
Johnny Wayne, Managing Director of AirSpace Machinery, puts the buyer’s check plainly: “Measure the demand and pressure at the point of use before deciding that the compressor is too small.” Use the Knowledge Base as the central technical hub, and continue with the system ROI guide and compressed-air dryer selection guidance.
For a forecast, submit power, pressure, FAD or equipment requirements, operating hours, electricity price, site temperature and altitude using the Free Compressed Air kWh Forecast & System Review. Forecasts are indicative; savings are planning baselines, not guarantees, and no fixed payback is promised.
Further Reading
If you are deciding between a new compressor and a system fix, start with the compressed air energy audit: the 5 checks that expose system waste, then return to this design blueprint. For payback math, see the system ROI guide.
SOURCES AND ENGINEERING STANDARDS
- U.S. DOE and Compressed Air Challenge, Improving Compressed Air System Performance: A Sourcebook for Industry, Third Edition. See distribution design, leakage, pressure drop, system assessment and energy costing: Sourcebook PDF.
- U.S. DOE, Minimize Compressed Air Leaks, Tip Sheet #3: leak-cost context and leak-program recommendations: DOE tip sheet.
- ISO 1217: use the applicable acceptance-test method and conditions when comparing compressor FAD and performance.
- ISO 8573-1: specify required air quality by class; limit Class 0 claims to models with supporting test reports.
AUTHOR BOX
Penny Winston, Technical Writer. Covers The 35% Energy Delta, The Fourth Utility Concept and ISO 8573-1 Class 0 Integrity. Class 0 claims require model-specific supporting reports.
Reviewed by Engineering
If you need air consumption calculation, energy-saving scheme and factory quotation, please send us an inquiry.
⚡ Is Your Factory Bleeding Cash?
Most fixed-speed compressors waste $3,600/year in "Unload Tax." Test your waste level in 30 seconds.
RUN THE ROI TEST →Ready to See How Much Your Facility Can Save?
Fill out the form below for a Free Energy Assessment.